Use it in
Charts in AI agent replies.
An agent can write a chart URL like any other text. With the MCP server, Claude, ChatGPT and Cursor do it for you.
How did uptime look this week?
AssistantSaturday dipped to 99.7%. Every other day was 99.95% or better. 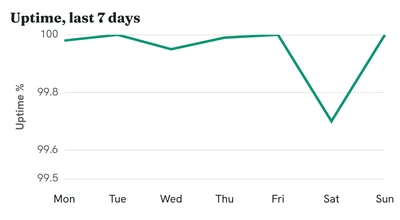
Illustration of a reply. The chart is real; the conversation is an example. Set it up.

Connect the MCP server
Add https://app.renderchart.com/mcp to your assistant. Starter and Pro.
Ask for a chart
Give it the numbers, or point it at data it can already read.
Reuse the URL
The reply's chart is an ordinary chart URL you can paste anywhere.
 Worth knowing.
- Without MCP
- Any agent that can write Markdown can output a chart image. Give it the URL pattern and your key.
- Limits
- Agents can repeat themselves. Repeated charts come from cache and cost nothing.