Use it in
Charts in email reports.
Email clients show images from a URL, so a chart URL in your HTML shows for every recipient. The first open renders the chart; every other open comes from cache.
Revenue, week 39To: team@yourcompany.com
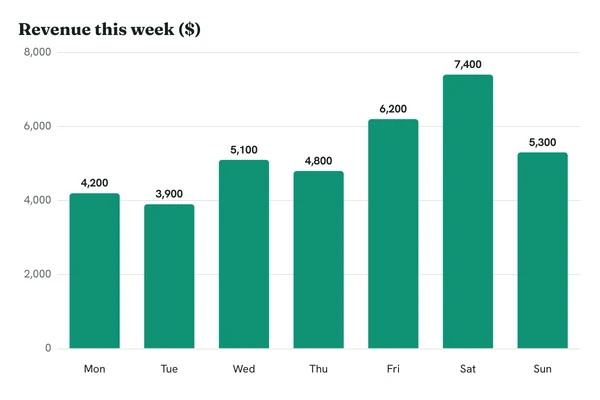
Morning. Revenue for last week is below. Saturday was the best day.
Set it up.

Write the URL
Start from the weekly revenue example and put your own numbers in y.
Fill it in when you send
Your report job joins this week's numbers with commas and drops them into the URL.
Paste it into the template
As an img tag with width 600 and alt text that says what the chart shows.
<img src="https://c.renderchart.com/?key=rc_pub_live_7Hq2mX9pLk4vN8sT1wEa&type=bar &x=Mon,Tue,Wed,Thu,Fri,Sat,Sun &y=4200,3900,5100,4800,6200,7400,5300 &title=Revenue%20this%20week%20%28%24%29 &values=1 &h=400 "
width="600" height="400" alt="Weekly revenue"> Worth knowing.
- Size
- w=600, the usual width of an email body. The default dpr=2 keeps it sharp on phones.
- Link tracking
- Unknown parameters are ignored, so utm_source and the like added by your email tool never break a chart or cause a new render.
- Alt text
- Some clients hold images until the reader allows them. Say what the chart shows: "Revenue this week, highest on Saturday at $7,400".
- Cost
- One render when the numbers change, however many people open the email.