Blog
Tutorials.
Each one takes one chart to one place it needs to go, from the first parameter to the pasted URL.

Comparisons
Chart image API pricing compared at 1,000 to 500,000 charts
What QuickChart, Image-Charts, RenderChart and a server of your own cost each month at seven volumes, and the billing units and limits that change the answer.
10 min read
Render Chart.js to an image without node-canvas
Chart.js needs a canvas and Node has none. Send the same config as one URL parameter and a PNG comes back server-side, with no native module to install.
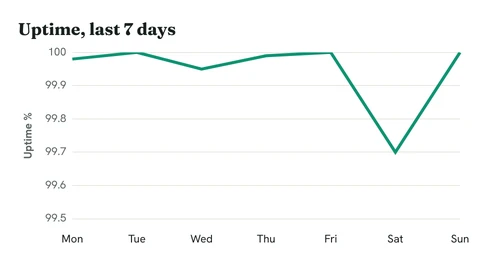
Add a chart to a GitHub README that updates itself
GitHub shows any image in a README and runs none of its JavaScript. Write the chart as an image URL, then let a weekly GitHub Action redraw it from fresh numbers.
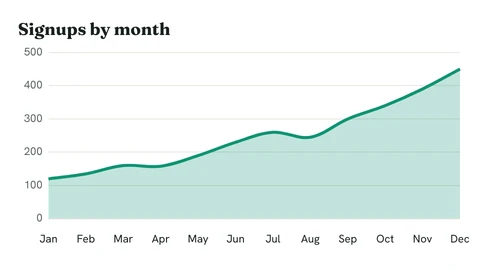
Add a chart to a PDF made with dompdf
Dompdf never runs JavaScript, so a Chart.js canvas comes out blank. Give it the chart as an image URL and the chart lands in the PDF, sharp enough to print.
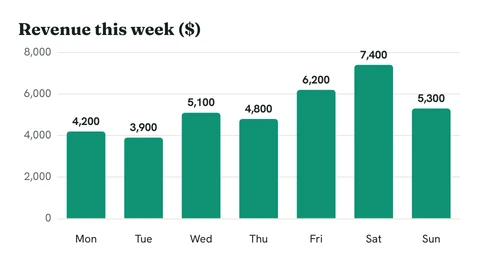
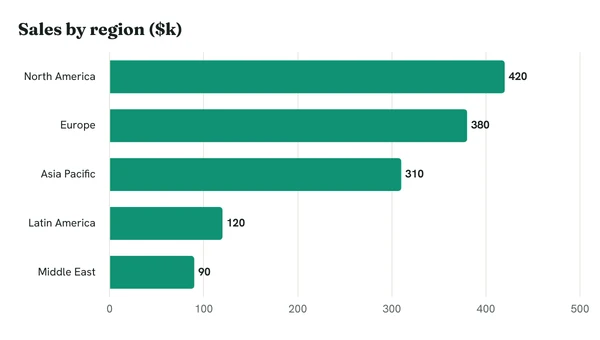
Add a weekly revenue chart to a Monday email report
Your Monday report already has the numbers. In this tutorial you'll turn last week's revenue into a bar chart that sits in the email itself, with no attachment and nothing to host.
Chart a column of numbers with =IMAGE()
TEXTJOIN turns a column into the comma list a chart URL needs, so the chart in the cell follows your data. No add-on, no Apps Script.
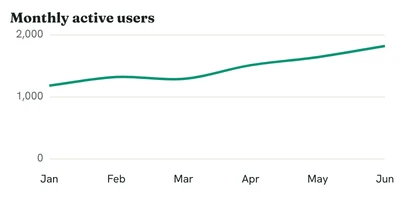
Move a Google Image Charts pie to RenderChart
cht, chd and chl map onto type, y and x. Here is the whole conversion, parameter by parameter, for a chart that stopped working when Google shut the service down.
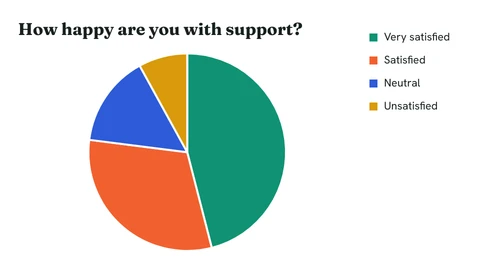
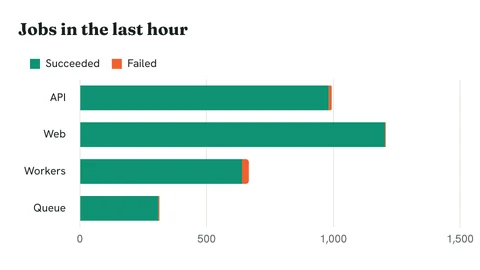
Post an hourly jobs chart to Slack from a cron job
Two stacked series, an image block and a schedule. Failures sit on top where people see them, and the channel gets a chart every hour without uploading a file.