BlogEmail reports
Add a weekly revenue chart to a Monday email report
Your Monday report already has the numbers. In this tutorial you'll turn last week's revenue into a bar chart that sits in the email itself, with no attachment and nothing to host.
What you’ll build
Figure 1
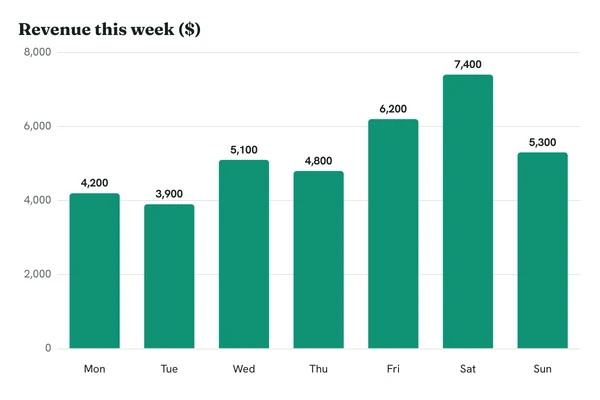
Revenue for each day of last week, with the values printed on the bars. 600 x 400, the usual width of an email body.
Write the URL
A chart URL is the endpoint, your key, and a few parameters. Each part has one job:
type=bar picks the chart, x holds the day labels and y the values, in the same order. values=1 prints each value on its bar, which helps in email where nobody can hover.
Fill it from your data
Whatever sends the report builds the URL just before it sends. Here is the idea in Node; any language with a URL encoder works the same way.
// Monday 07:00: build the chart URL from last week's revenue
const days = ["Mon", "Tue", "Wed", "Thu", "Fri", "Sat", "Sun"];
const revenue = await getWeeklyRevenue(); // [4200, 3900, 5100, 4800, 6200, 7400, 5300]

const params = new URLSearchParams({
  key: process.env.RENDERCHART_KEY,
  type: "bar",
  x: days.join(","),
  y: revenue.join(","),
  title: "Revenue this week ($)",
  values: "1",
  h: "400",
});
const chartUrl = "https://c.renderchart.com/?" + params;
URLSearchParams encodes the title for you. It also encodes the commas between values as %2C, which the chart endpoint decodes, so the URL works either way.
Put it in the email
Use a plain img tag with the width set and alt text that says what the chart shows. Some clients hold images until the reader allows them, and the alt text is what they see first.
<img src="https://c.renderchart.com/?key=rc_pub_live_7Hq2mX9pLk4vN8sT1wEa&type=bar &x=Mon,Tue,Wed,Thu,Fri,Sat,Sun &y=4200,3900,5100,4800,6200,7400,5300 &title=Revenue%20this%20week%20%28%24%29 &values=1 &h=400 "
width="600" height="400" alt="Revenue this week, highest on Saturday at $7,400"> Remove the watermark
Unsigned URLs carry a small renderchart.com mark in the corner. On a paid plan, add a signature and the chart renders clean. Signing shows how to compute it on your server so your secret never leaves it.
What it costs
The first request for a chart renders it. Every other open of the email, by anyone, comes from cache and doesn’t count. New numbers next Monday make a new chart, so this report uses one render a week.
Your email tool may add utm_source or similar to links and images. RenderChart ignores parameters it doesn’t know, so they never cause a new render.

Chart not showing?
Open the URL in a browser. If something is wrong you’ll get an image that says what, such as Invalid chart URL or Unknown or revoked key. Every error image