BlogChart.js
Render Chart.js to an image without node-canvas
Chart.js needs a canvas and Node has none. Send the same config as one URL parameter and a PNG comes back server-side, with no native module to install.
Chart.js draws on a <canvas>, and Node has no canvas. The config that draws your dashboard in the browser has nothing to draw on when a cron job needs the same chart for the Monday email or a PDF invoice. The usual fix is chartjs-node-canvas, which gives Chart.js a canvas built on Cairo through the native canvas package. It works on a laptop. Production is where the trouble starts.
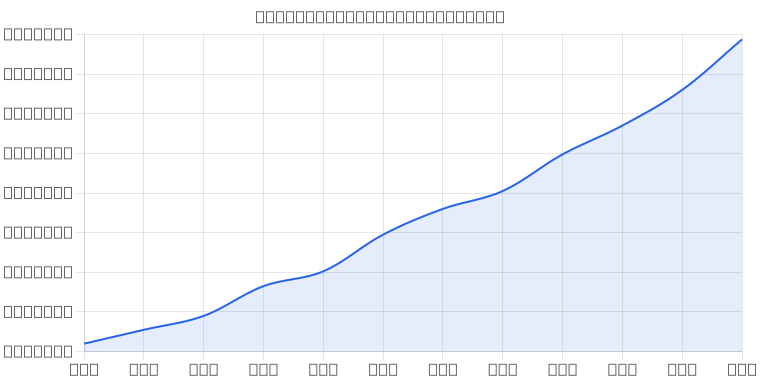
The other route needs no canvas at all. Turn the config into JSON, put it in a URL as cfg, and RenderChart draws it and returns a PNG. This chart was drawn from a Chart.js 4 line config passed exactly that way:
Before you write any code, paste your own config into the converter on our QuickChart comparison page, which takes a Chart.js config and shows the URL it becomes beside the chart it draws. Try it with the config you have open now.
What node-canvas brings with it
On 8 November 2026 we installed both native routes on Ubuntu 24.04 with Node 22 and drew the config above with each, five times in a row.
| Route | Packages | node_modules | First chart | Each one after |
|---|---|---|---|---|
| chart.js, chartjs-node-canvas, canvas | 41 | 33 MB | 799 ms | 23 to 28 ms |
| chart.js, @napi-rs/canvas | 4 | 42 MB | 54 ms | about 21 ms |
| A chart URL | none | none | 2.5 to 6.7 s | 0.26 s from cache |
Locally drawn charts are fast once the process is warm. If your server already draws them happily, stay put.
The cost is in what gets installed. Of the 33 MB, 24 MB is canvas: a compiled canvas.node and the 25 shared libraries it brings along, from Cairo and Pango down to its own copy of libstdc++. @napi-rs/canvas swaps all of that for a single 36 MB Skia binary. Either way the binary has to match the machine that runs it, right down to the Node version. Pack node_modules on a Mac, deploy it to a Linux function, and it fails the moment canvas loads. The errors people post are variations on a few: canvas.node: cannot open shared object file on AWS Lambda, or a module “compiled against a different Node.js version” on Netlify Functions.
The fonts nobody installed
Our test machine has 335 fonts. The first local charts looked fine. A server built from a slim image may have none. To see what happens then, we hid every font directory from the process, checked that fc-list found nothing, and drew the same config again.
node-canvas drew every label as a row of empty boxes. @napi-rs/canvas left the text out altogether and drew only the line and the grid. Neither threw an error, and both returned a perfectly valid PNG, so a job that only checks it got a buffer back will send it to your customers.
If you stay with a native canvas, install a font package in the image (fonts-dejavu-core on Debian and Ubuntu) or ship a TTF with your code and register it with registerFont in canvas or GlobalFonts.registerFromPath in @napi-rs/canvas. RenderChart’s renderer embeds its fonts in the page it draws on, so a chart URL has nothing to install.
Send the config as a URL instead
This is the whole client. It needs Node 18 or later and no packages:
// chart-url.mjs: turn a Chart.js config into a signed RenderChart URL
import { createHmac } from 'node:crypto';

const { RENDERCHART_KEY, RENDERCHART_SECRET } = process.env;

const rfc3986 = (v) =>
  encodeURIComponent(v).replace(/[!'()*]/g, (c) => '%' + c.charCodeAt(0).toString(16).toUpperCase());

export function chartUrl(config, { w = 760, h = 380 } = {}) {
  const params = {
    key: RENDERCHART_KEY,
    cfg: Buffer.from(JSON.stringify(config)).toString('base64url'),
    w: String(w),
    h: String(h),
  };
  const canonical = '/?' + Object.keys(params).sort().map((k) => `${k}=${rfc3986(params[k])}`).join('&');
  const sig = createHmac('sha256', RENDERCHART_SECRET).update(canonical).digest('base64url');
  return `https://c.renderchart.com/?${new URLSearchParams(params)}&sig=${sig}`;
}
cfg is the config as base64url JSON. key is your public key, made to appear in URLs, and the signature is an HMAC of the sorted parameters made with your secret, which never leaves the server. The canonical string is explained step by step in the signing guide’s Node section. On a paid plan a signed chart carries no watermark, and changing one number in the URL breaks the signature, so nobody can edit your revenue figures on the way.
Using it looks like this:
import { chartUrl } from './chart-url.mjs';

const url = chartUrl(config); // the object you already pass to new Chart()
const html = `<img src="${url}" width="760" height="380" alt="Monthly recurring revenue">`;

// When you need the bytes instead (a PDF library, an upload, an attachment)
const png = Buffer.from(await (await fetch(url)).arrayBuffer());
The URL for the chart at the top is 891 characters long, the first request for it took 6.7 seconds while the chart was being drawn, and the second came back from the edge cache in 0.26 seconds. The PNG weighed 87 KB at 1,520 by 760 pixels, twice the size asked for, so it stays sharp on a phone. chartjs-node-canvas draws at 760 by 380 unless you set devicePixelRatio yourself.
Where the chart is going matters more than the speed. An email shows an image from a URL, so the URL can be the src and there is nothing to upload or attach; charts in email reports covers the template side. A chart drawn locally has to live somewhere before an inbox can show it, which means an S3 bucket and a public link, or an attachment in every message. For a PDF you fetch the bytes, as the dompdf tutorial does.
What survives JSON.stringify
Functions do not. JSON.stringify drops them without a word:
JSON.stringify({ ticks: { callback: (v) => '$' + v } });
// '{"ticks":{}}'
So a config with a tick callback arrives without it, and the axis shows bare numbers. Advanced mode would not run a function anyway. Chart.js 4 has a JSON answer for the most common one: ticks.format takes Intl.NumberFormat options, and that is where the dollar signs above came from.
"scales": {
  "y": { "ticks": { "format": { "style": "currency", "currency": "USD", "maximumFractionDigits": 0 } } }
}
Percentages caught us out. We added a conversion rate on a second axis with { "style": "percent", "maximumFractionDigits": 0 }, and the whole chart failed. Locally, chartjs-node-canvas threw “maximumFractionDigits value is out of range”. The reason is in Chart.js’s tick formatter: it sets minimumFractionDigits from the gap between ticks (two decimals for a 2% step) and then applies your format on top, and a minimum above the maximum is an error. Set both:
"format": { "style": "percent", "minimumFractionDigits": 0, "maximumFractionDigits": 0 }Time axes are the other trap. type: 'time' needs a date adapter such as chartjs-adapter-date-fns loaded beside Chart.js, and the renderer has none. Locally that config threw “This method is not implemented: Check that a complete date adapter is provided.” Format the dates on your server and send them as ordinary labels.
Through the URL, both failures looked identical. Each came back as a blank white PNG with a 200 status and no X-RC-Error header. If a chart is ever empty, paste its config into a browser console with Chart.js loaded: whatever Chart.js throws there is the reason.
Plugins are filtered too. options.plugins keeps four of Chart.js’s own (legend, title, subtitle, tooltip) and two of RenderChart’s (values, background). Anything else is removed before drawing. Options for chartjs-plugin-datalabels disappear and the labels go with them; in our test, "values": { "enabled": true } printed each bar’s number instead. A string with http: or data: in it is stripped as well, so nothing in a config can load an image or reach the network.
How much data fits in a URL
A chart URL can be 8,000 characters long. Base64 makes JSON a third longer, which leaves a minified config about 5,900 bytes. A year of daily values in one series fitted with room to spare: a 4,977-byte config, a 6,764-character URL. A second series did not. Two series of 334 days made 8,688 characters, and what came back was the 400 error image with X-RC-Error: url_too_long in its headers. We tried saving a slightly smaller version as a short URL instead, on the theory that a chart saved in the account would escape the limit, and the API refused it for the same reason.
Plain parameters skip the JSON keys and the base64. That makes them much denser:
One catch cost us a failed request: write the commas as commas. URLSearchParams encodes each one as %2C, three characters where one would do, and that pushed the same URL to 8,438 characters and the error image. Undo it after encoding; the signature does not change, because it is computed on the decoded values:
const query = new URLSearchParams(params).toString().replaceAll('%2C', ',');The limits table in the URL specification has the rest, including 500 points per series and ten series per chart.
On Workers and edge functions
A Cloudflare Worker or an edge function runs JavaScript in a V8 isolate and cannot load a native module at all, so canvas is ruled out before you ever see an ELF header error. A URL is just a string. The only hard part is the hash, and Web Crypto, which those runtimes all have, does that:
// chart-url-edge.mjs: the same URL with Web Crypto, for Workers and edge functions
const enc = new TextEncoder();
const b64url = (bytes) =>
  btoa(String.fromCharCode(...new Uint8Array(bytes))).replace(/\+/g, '-').replace(/\//g, '_').replace(/=+$/, '');
const rfc3986 = (v) =>
  encodeURIComponent(v).replace(/[!'()*]/g, (c) => '%' + c.charCodeAt(0).toString(16).toUpperCase());

export async function chartUrl(config, env, { w = 760, h = 380 } = {}) {
  const params = {
    key: env.RENDERCHART_KEY,
    cfg: b64url(enc.encode(JSON.stringify(config))),
    w: String(w),
    h: String(h),
  };
  const canonical = '/?' + Object.keys(params).sort().map((k) => `${k}=${rfc3986(params[k])}`).join('&');
  const hmac = await crypto.subtle.importKey('raw', enc.encode(env.RENDERCHART_SECRET), { name: 'HMAC', hash: 'SHA-256' }, false, ['sign']);
  const sig = b64url(await crypto.subtle.sign('HMAC', hmac, enc.encode(canonical)));
  return `https://c.renderchart.com/?${new URLSearchParams(params)}&sig=${sig}`;
}
We ran this version and the Node one over the same two configs, and the URLs they wrote matched character for character, signature included, so a Worker and a Node job can hand out the same chart.
What it costs
A render is the first request for a chart. Every request after that comes from cache and costs nothing, however many people open the email, so a nightly job that sends three charts makes about 90 renders a month. The free plan’s 50 renders a month are enough to build and test with, though every chart on it carries a small watermark, even a signed one. Starter is $29 a month for 5,000 renders and draws signed charts without the watermark. Past the allowance, signed charts carry on as extra renders at $5 per 1,000, which you can cap or turn off.
The native route costs nothing per chart. You pay in upkeep instead: a binary that must match every machine it runs on, and fonts in every image. Then the PNG still needs somewhere to live.
You already have the config. Create a free account and put your key and secret in the environment. Then pass that config to chartUrl(). The first chart costs one of your 50 free renders, and it shows you at once whether anything in the config needs one of the changes above.