BlogComparisons
Chart image API pricing compared at 1,000 to 500,000 charts
What QuickChart, Image-Charts, RenderChart and a server of your own cost each month at seven volumes, and the billing units and limits that change the answer.
QuickChart’s paid plan is $40 a month. Image-Charts starts at $99 and RenderChart at $29. You cannot rank those prices as they stand, because each one buys a different thing: 10,000 images, charts without limit, 5,000 renders.
We make RenderChart, so one of the three wrote this page. Check it. Every competitor’s price was read from that vendor’s own pricing page on 18 November 2026, every measurement was taken the same day, and where someone else is cheaper the tables say so.
This is the monthly bill for the cheapest plan that draws a chart without a watermark:
Below 30,000 charts a month RenderChart is the cheapest paid option, with one gap: between 7,200 and 10,000 charts QuickChart’s flat $40 undercuts our Starter plan plus extra renders. From 30,000 upwards the flat $99 from Image-Charts wins, and it wins by more the further you go, as long as your charts fit inside its limits.
What each service charges
| Plan | Price a month | What it buys |
|---|---|---|
| QuickChart Community | $0 | Rate limited, no watermark, shared servers |
| QuickChart Professional | $40 | 10,000 images and 50,000 short URLs |
| QuickChart Enterprise | By quote | Unlimited charts, an SLA, custom fonts and domain |
| Image-Charts Individual | $0 | Unlimited charts with a watermark |
| Image-Charts Business | $99, or $89 paid yearly | Unlimited charts, no watermark, Zapier and Make |
| Image-Charts Enterprise | $249, or $224 paid yearly | Business plus high resolution, compound charts and extra axes |
| RenderChart Free | $0 | 50 renders with a watermark |
| RenderChart Starter | $29 | 5,000 renders, then $5 per 1,000 |
| RenderChart Pro | $79 | 25,000 renders, then $4 per 1,000 |
| RenderChart Business | $199 | 150,000 renders, then $3 per 1,000 |
The QuickChart rows come from quickchart.io/pricing and the Image-Charts rows from image-charts.com/pricing.html. Ours are on the pricing page, where a year costs ten times a month. Every paid plan also includes the MCP server, which lets an AI assistant such as Claude or ChatGPT write signed chart URLs for you.
Image-Charts sells an on-premise version too. Its pricing page gives two starting prices for it, €350 a month in one place and €241.66 in another, both billed annually, so ask which applies.
The monthly bill at seven volumes
Each cell is the cheapest way to draw that many charts in a month with no watermark on them.
| Charts a month | QuickChart | Image-Charts | RenderChart |
|---|---|---|---|
| 1,000 | $0, at the free tier’s limit | $99 | $29 |
| 5,000 | $40 | $99 | $29 |
| 10,000 | $40 | $99 | $54 |
| 25,000 | By quote | $99 | $79 |
| 50,000 | By quote | $99 | $179 |
| 150,000 | By quote | $99 | $199 |
| 500,000 | By quote | $99 | $1,249 |
The RenderChart column takes whichever is cheaper, a plan with extra renders or the next plan up. At 10,000 charts that is Starter plus 5,000 extra renders at $5 per 1,000, so $29 and $25. At 50,000 it is Pro plus 25,000 extra at $4 per 1,000. The $1,249 at 500,000 is Business plus 350,000 extra at $3 per 1,000. For a volume the table skips:
def renderchart_bill(charts):
    plans = [(29, 5_000, 5), (79, 25_000, 4), (199, 150_000, 3)]  # price, renders, $ per 1,000 extra
    return min(price + max(0, charts - renders) * extra / 1000 for price, renders, extra in plans)

print(renderchart_bill(30_000))  # 99.0, level with Image-Charts Business
QuickChart’s $0 at 1,000 charts needs a note. About the free tier, its pricing page says only “Rate limit enforced”. The number comes from QuickChart’s founder, who answered a question on the community forum on 12 April 2025: 60 images a minute, or 1,000 a month. Past 10,000 images there is no published rate for extra ones, and the next plan up is Enterprise.
The Image-Charts column assumes Business is enough. High-resolution images are an Enterprise feature, and so are charts with more than two axes. Need either and the column reads $249 on every row, which moves the point where Image-Charts becomes cheaper than RenderChart from 30,000 charts a month to about 167,000.
Now the bottom row. At half a million charts a month Image-Charts costs about a twelfth of what we do. If that is your volume and its limits suit your charts, buy it.
Check what counts as one chart
The table rests on an assumption: a chart is counted once, however many times it is opened.
For RenderChart that is the published rule: the first request for a chart is a render, and every later request for the same URL comes from cache and does not count, so a chart in an email report costs one render whether 12 people open the email or 12,000. Image-Charts does not meter at all. QuickChart is the unknown. It sells 10,000 “images”, and we could not find a page that says whether a second request for the same chart is a second image.
So we looked at what each service does. We asked all of them for the same new bar chart four times in a row, from a server in the United States, and read the response headers. You can repeat it:
curl -s -o /dev/null -D - "https://quickchart.io/chart?c=%7Btype%3A%27bar%27%2Cdata%3A%7Blabels%3A%5B%27Mon%27%2C%27Tue%27%5D%2Cdatasets%3A%5B%7Bdata%3A%5B4210%2C3875%5D%7D%5D%7D%7D" | grep -i -E "^(cache-control|cf-cache-status)"
curl -s -o /dev/null -D - "https://image-charts.com/chart?cht=bvs&chs=600x400&chd=a:4210,3875&chxt=x,y&chxl=0:|Mon|Tue" | grep -i -E "^(cache-control|cf-cache-status)"
curl -s -o /dev/null -D - "https://c.renderchart.com/?key=rc_pub_live_YOUR_KEY&type=bar&x=Mon,Tue&y=4210,3875" | grep -i -E "^(cache-control|x-rc-cache)"| Service | Cache-Control on the image | What answered requests two to four |
|---|---|---|
| QuickChart | private | QuickChart itself, every time (cf-cache-status: DYNAMIC) |
| Image-Charts | public, max-age=691200, must-revalidate | Its CDN, from the second or third request (cf-cache-status: HIT) |
| RenderChart | public, max-age=31536000, immutable | The edge cache (X-RC-Cache: edge) |
private tells shared caches (a CDN, say) not to keep a copy, so each new viewer’s request travels back to QuickChart. Its caching page says successful GET requests are kept on QuickChart’s side for up to a week. Whether a repeat served from that store draws down the 10,000 is the question to ask before you budget. Our table takes the reading kindest to QuickChart: one chart, one image. Under the other reading, a single chart in a newsletter to 12,000 subscribers would use the month’s allowance by itself.
Whichever service you are pricing, work out two numbers first: how many different charts you draw in a month, and how many times they are looked at. An account summary sent to 3,000 customers, each with their own figures, is 3,000 charts. One company chart sent to the same 3,000 people is one.
What the free tiers allow
| QuickChart Community | Image-Charts Individual | RenderChart Free | |
|---|---|---|---|
| Watermark | None | Small text, top right | Small text, bottom right |
| Monthly allowance | 1,000 images | No limit | 50 renders |
| Rate limit | 60 images a minute | 10 requests a minute from one address | 20 renders a minute |
| Account needed | No | No | Yes |
QuickChart’s free tier is the most generous of the three by a distance, with twenty times our allowance and no watermark. The terms: shared servers, no SLA, and charts that are public domain according to its FAQ. If 1,000 charts a month on those terms covers you, you do not need to pay anyone, us included.
The ten requests a minute on Image-Charts are counted per address and apply to requests made without a paid signature. Go over and that address is blocked for a minute, according to its limits and quotas page.
The limits that push you up a plan
A low price per chart is no use if the chart arrives soft, or slow, or stops loading in six months.
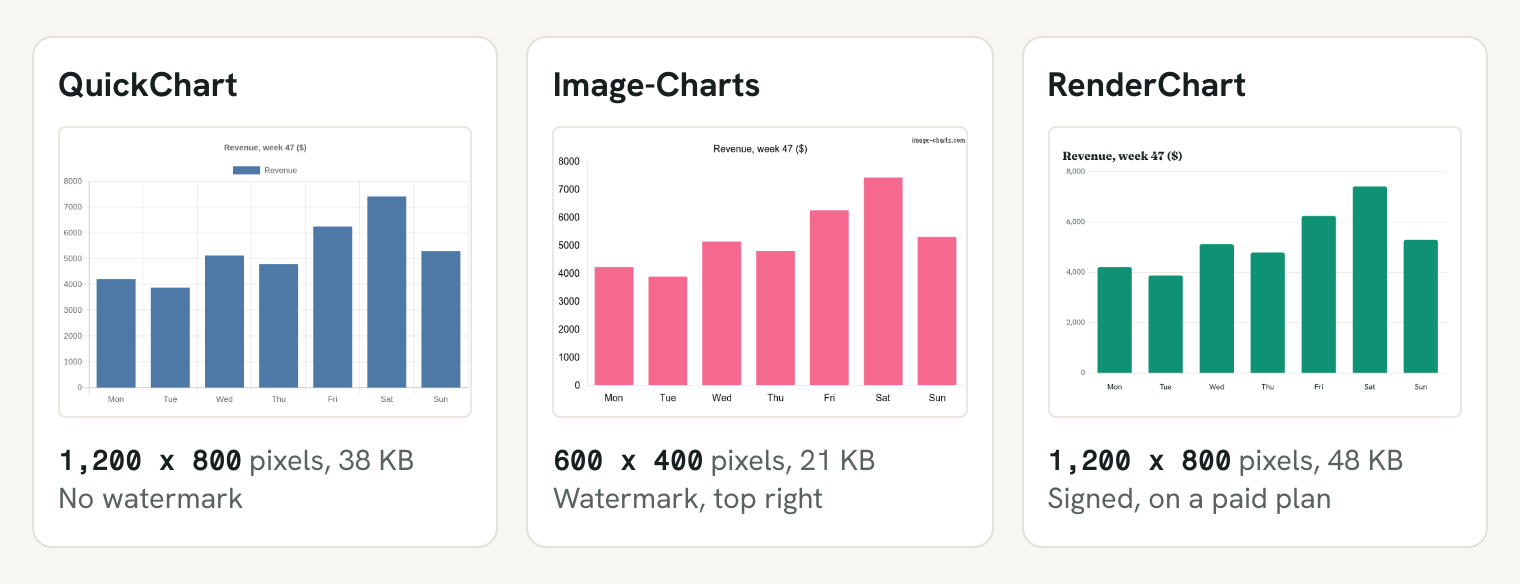
We asked all three for 600 by 400. QuickChart and RenderChart drew at twice that, 1,200 by 800 pixels, which is what a phone or a recent laptop screen needs. Image-Charts returned 600 by 400. Its documentation caps a chart at 999 pixels a side, and its pricing page lists high-resolution output under Enterprise, the $249 plan. RenderChart accepts up to 2,000 by 2,000 and a pixel ratio of up to 3 on every plan, the free one included, capped at 4,096 pixels across. QuickChart’s docs give its defaults (500 by 300, at twice the pixel ratio) and no maximum that we could find.
Speed went the other way.
RenderChart was the slowest of the three on a chart nobody had asked for before, and by a wide margin: 3.3 to 3.9 seconds over three runs, against under a second for the others. We draw each new chart in a browser and then keep it, so the repeats took about 0.4 seconds. If a person is waiting on that first request, as they are in a chat reply, they will notice. A job that builds an email can fetch each chart once before it sends.
Saved charts have a lifespan. QuickChart’s short URLs expire after three days on the free tier and after six months on a paid plan, so a short chart URL in an invoice email shows nothing when the customer reopens it next year. A RenderChart short URL needs Starter and has no expiry.
Then there is what you are allowed to send. QuickChart runs JavaScript inside a Chart.js config. On its free endpoint a tick callback put dollar signs on the axis for us, and custom plugins come with Professional. RenderChart takes plain parameters or a Chart.js 4 config as JSON and runs no functions. Image-Charts speaks the old Google Image Charts parameters and accepts a Chart.js config too.
Our own watermark has a catch. A paid RenderChart plan removes the mark from signed and short URLs only, and a URL written by a spreadsheet formula or a merge tag cannot be signed, so it keeps the mark however much you pay. The docs list which kind of URL goes where. QuickChart has no watermark on any tier.
What your own renderer costs
The server is the cheap part. 150,000 charts a month is one chart every 17 seconds. When we timed node-canvas, a warm process drew a chart in 23 to 28 milliseconds, so a $12 droplet with 2 GiB of memory would sit idle nearly all month. On AWS Lambda the same month fits inside the free tier. Allow a generous 1.5 seconds and 1 GB for each chart and the total is 225,000 GB-seconds, and the first 400,000 are free.
Time is the expensive part. QuickChart’s pricing page carries a build-or-buy calculator whose defaults are a $40 server and two hours a month of someone’s time at $50 an hour, which comes to $140 a month against its own $40 plan. Under the calculator is a list of the work. It adds up to 179 hours before launch, 72 of them spent sandboxing the renderer so that a chart config cannot run arbitrary JavaScript, and 20 or more hours a month afterwards. A vendor has every reason to make that list long. Swap in the $12 server, keep the two hours, and hosted plans still come out ahead:
At $50 an hour, a $12 server beats our $29 plan only if its upkeep takes under 20 minutes a month.
If the renderer you would run is QuickChart’s open-source one, read its README first. Its licence is AGPL v3, and changing the code for commercial use without publishing your changes means a conversation with the author. There are no short URLs in the self-hosted version. On Docker Hub, the public image ianw/quickchart was last pushed on 2 October 2023. And the README warns that a config can contain arbitrary JavaScript, so an instance has to be sandboxed before anything untrusted can reach it.
Running your own is still right in two cases. Your data may not be allowed to leave your network. Or you already run a renderer that nobody has had to touch this year. Then a hosted plan buys you nothing.
Which service fits which job
If you draw up to 1,000 charts a month and can live without an SLA, use QuickChart’s free tier. If your configs depend on JavaScript callbacks or plugins, RenderChart will not run them and QuickChart will. Between 7,200 and 10,000 images a month its Professional plan is also the cheapest.
Image-Charts Business costs $99 whatever the volume. From 30,000 different charts a month it is the cheapest service here, provided 999 pixels a side at standard resolution is enough.
On published prices, RenderChart costs least from 1,001 charts a month to 7,200 and again from 10,001 to 30,000. That count is of different charts, so one chart opened 12,000 times is still one. It is also the service to choose when the image has to be sharp on the cheapest plan, or when a saved URL has to keep working for years. If you are coming from QuickChart, paste a config into the converter on the QuickChart comparison page and it shows the URL that config becomes. URLs still in Google’s old format go through the Google Image Charts converter the same way.
The free plan’s 50 renders are enough to redraw the charts you send most and hold them against what you have now. Create a free account, sign one URL, and time the first request yourself.